Is your manufacturing company getting the most out of your marketing spend? Now, you can visibly see how you’re performing compared to other manufacturers in your industry.
As part of our partnership with Databox, we launched a new benchmark group called Marketing Metrics for B2B Manufacturing Companies. This group is designed to capture and share key marketing metrics to maximize the value of your marketing spend.
You can participate in the group to access key metrics, take our survey to provide input, and view results that matter to your company. We are confident that the data-driven information will help your company improve ROI on your marketing spend.
– Join our Databox benchmark group.
Who Should Participate in Our Benchmark Group?
We created this benchmark group specifically for B2B manufacturing companies generating between $10 and 500 million in annual revenue. At the core, your company should manufacture a product that is sold through distribution or direct sale to a B2B end user.
We want to bring together manufacturing companies from various industries and sectors to ensure we have a diverse data set to help other companies compare against. This initiative can be a tremendous resource for manufacturing companies seeking to gauge their performance relative to peers and industry standards.
Participation in this benchmark group will enable your company to identify areas of strength and room for improvement. The varied data set ensures that insights gained reflect many manufacturing sectors.
When your company joins our group, you can view the current benchmarks and personalize the benchmarks to fit the metrics your company is most concerned about.
Which Marketing Metrics Should You Pay Attention To?
Our benchmark group is set up to track and measure the following Key Performance Indicators (KPIs) that are crucial in manufacturing marketing:
- Website Sessions
- New Website Users
- Website Events
- User Engagement
- Website Impressions
- Website Position
- Website Clicks
- LinkedIn Followers
- LinkedIn Updates
- LinkedIn Impressions
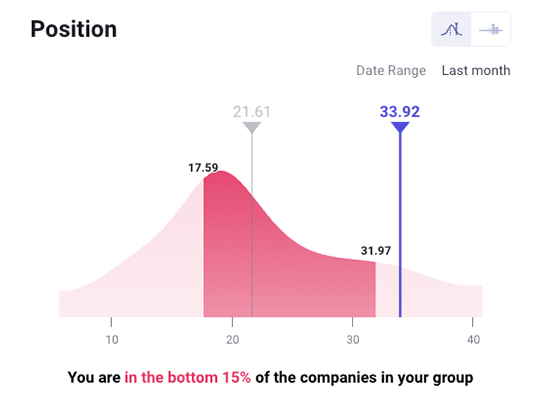
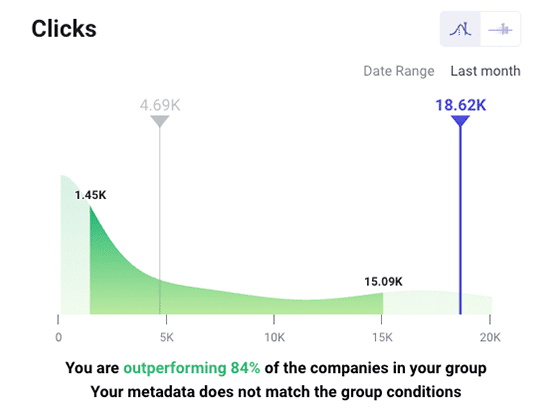
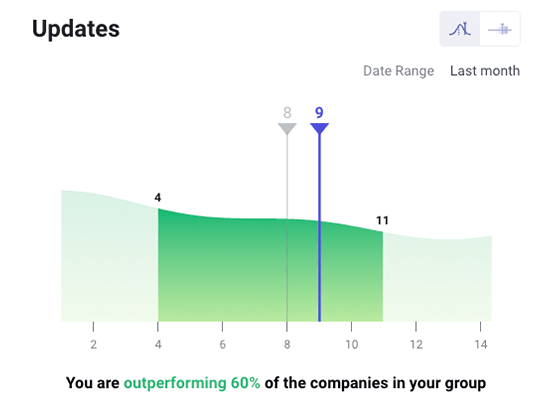
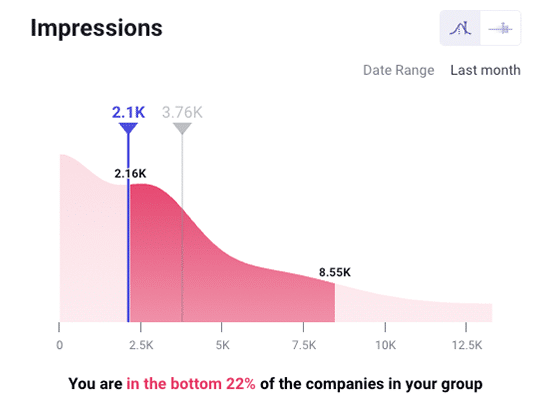
Find out more about each of these metrics below. Also, view sample graphs from companies in your industry. The graphs capture the bottom quartile of performance (left side of the graph), the median performance level (middle arrow), and the top quartile of performance (right side of the graph). Find out where your company ranks compared to peers in your industry.
Website Sessions
The number of website sessions is a key B2B metric that reflects your online visibility. Analyzing session data provides insights into user engagement, preferences, and the journey through your site, enabling you to adjust content to better align with your target audience’s needs.
Also, gaining a deep understanding of website sessions can help pinpoint the most effective marketing strategies to drive traffic, allowing for smarter budget allocation and enhanced ROI.

New Website Users
Monitoring new website users can help you assess the impact and success of online marketing strategies. An uptick in new users signals that your outreach, including SEO and content marketing, is effectively drawing in potential leads interested in your products and services.
Additionally, understanding the behavior and feedback of these new visitors can offer crucial insights into user preferences as they navigate your website. You can use this metric to refine your offerings to better align with the needs of your prospects and clients.

Website Events
Tracking website events can reveal how users interact with specific elements of your website, such as product demos, downloads, or contact form submissions. This data helps in understanding which features or content are driving the most engagement, providing a clear direction for content strategy and website optimization.
Analyzing these interactions can also improve lead generation and conversion rates. Your company can more accurately tailor marketing efforts and website design to meet the needs of your target audience.

User Engagement
User engagement indicates how effectively your company’s website and content captivates your target audience. High levels of engagement suggest that visitors find your content valuable and relevant, increasing the likelihood of converting them into leads and customers.
Also, understanding patterns of engagement can help your company refine digital marketing strategies, ensuring that you continue to deliver content that resonates and supports lead generation efforts.

Website Impressions
Website impressions help gauge your company’s brand visibility and reach with your audience. A high number of impressions indicates that your company’s website appears frequently in search results, suggesting a strong SEO presence.
This metric is valuable for evaluating the effectiveness of your content during the initial stage of the buyer’s journey. You can use this data to understand your market presence and adjust digital marketing efforts to enhance visibility and attract more potential clients.

Website Position
Website position is tied to your company’s visibility in search engine results. This metric captures how easily potential clients can find your products and services online.
A top-ranking position can help boost credibility and trust among prospects, signaling authority in your industry. A strong website position can also lead to increased organic traffic, which is essential for generating high-quality leads.

Website Clicks
Website clicks indicate the effectiveness of your online presence, reflecting the interest level of potential clients in your solutions. A higher number of clicks suggests that the content and calls-to-action (CTAs) on your website are compelling and drive engagement.
Analyzing which areas of your website receive the most clicks can help with optimizing the user experience and your company’s content strategy, leading to stronger conversion rates and business growth.

LinkedIn Followers
A substantial number of LinkedIn followers can enhance brand credibility and establish authority in your industry. These followers represent a directly engaged audience that can be easily reached with updates, product launches, and industry insights.
A strong LinkedIn presence can also help amplify your company’s reach and effectiveness in networking. We recommend leveraging the platform to build business relationships and support lead generation efforts.
LinkedIn Updates
The frequency and quality of LinkedIn posts are critical for maintaining visibility and engagement within your company’s professional community. Regular posting keeps your company top-of-mind among followers, showcases ongoing activity, and helps build thought leadership.
A consistent flow of valuable content can drive higher engagement rates, strengthen brand presence, and enhance lead generation efforts. Remember that each post represents an opportunity to interact with potential clients and industry partners.

LinkedIn Impressions
The number of impressions on your LinkedIn posts indicates the level of engagement in your brand. A high number of impressions indicates that your company’s posts are seen by a wide audience, which can establish your company as a thought leader in your sector.
Tracking LinkedIn impressions can also help you improve your social strategy to maximize engagement and effectively target the right audience. Using data to refine your use of LinkedIn will help increase the likelihood of generating leads.

Marketing Metrics for B2B Manufacturing Companies: Join Today
We invite you to participate in our benchmark group to measure the performance of your marketing efforts. Your company will gain access to comparative data across a diverse range of sectors, enabling you to understand the performance of your program.
Our data-focused approach supports informed decision-making, highlights areas for improvement, and identifies competitive advantages to drive growth. Tap into this opportunity to turn data into an asset for your company.
– Join our Databox benchmark group to measure your performance.
– Take our 5-minute survey to share your insights.
– Did the benchmark metrics reveal you are not getting enough from your marketing dollars? Schedule a free consultation with me. Find out how to schedule a time to discuss the marketing metrics for B2B companies that hit home.


